Getting Apache to output JSON (for logstash 1.2.x)

Greetings, travelers, who may have come to this page by way of my other page on this subject, dealing with the same subject matter, but with logstash version 1.1.x.

Logstash 1.2.1 is brand new as of this edition.  The changes to my Apache CustomLog JSON recipe are in! I’ve even since updated this page to not use the prune filter but exclusively use the new logstash conditionals.

Apache configuration:

LogFormat "{ 
            "@timestamp": "%{%Y-%m-%dT%H:%M:%S%z}t", 
            "@version": "1", 
            "vips":["vip.example.com"], 
            "tags":["apache"], 
            "message": "%h %l %u %t \"%r\" %>s %b", 
            "clientip": "%a", 
            "duration": %D, 
            "status": %>s, 
            "request": "%U%q", 
            "urlpath": "%U", 
            "urlquery": "%q", 
            "bytes": %B, 
            "method": "%m", 
            "referer": "%{Referer}i", 
            "useragent": "%{User-agent}i" 
           }" ls_apache_json
CustomLog /var/log/apache2/logstash_test.ls_json ls_apache_json

Logstash configuration:

input {
   file {
      path => "/var/log/apache2/*.ls_json"
      tags => "apache_json"
      codec => "json"
   }
}

filter {
    geoip {
	add_tag => [ "GeoIP" ]
	database => "/opt/logstash/GeoLiteCity.dat"
	source => "clientip"
    }
    if [useragent] != "-" and [useragent] != "" {
      useragent {
        add_tag => [ "UA" ]
        source => "useragent"
      }
    }
    if [bytes] == 0 { mutate { remove => "[bytes]" } }
    if [geoip][city_name]      == "" { mutate { remove => "[geoip][city_name]" } }
    if [geoip][continent_code] == "" { mutate { remove => "[geoip][continent_code]" } }
    if [geoip][country_code2]  == "" { mutate { remove => "[geoip][country_code2]" } }
    if [geoip][country_code3]  == "" { mutate { remove => "[geoip][country_code3]" } }
    if [geoip][country_name]   == "" { mutate { remove => "[geoip][country_name]" } }
    if [geoip][latitude]       == "" { mutate { remove => "[geoip][latitude]" } }
    if [geoip][longitude]      == "" { mutate { remove => "[geoip][longitude]" } }
    if [geoip][postal_code]    == "" { mutate { remove => "[geoip][postal_code]" } }
    if [geoip][region_name]    == "" { mutate { remove => "[geoip][region_name]" } }
    if [geoip][time_zone]      == "" { mutate { remove => "[geoip][time_zone]" } }
    if [urlquery]              == "" { mutate { remove => "urlquery" } }

    if "apache_json" in [tags] {
        if [method]    =~ "(HEAD|OPTIONS)" { mutate { remove => "method" } }
        if [useragent] == "-"              { mutate { remove => "useragent" } }
        if [referer]   == "-"              { mutate { remove => "referer" } }
    }
    if "UA" in [tags] {
        if [device] == "Other" { mutate { remove => "device" } }
        if [name]   == "Other" { mutate { remove => "name" } }
        if [os]     == "Other" { mutate { remove => "os" } }
    }
}

output {
     elasticsearch {
       host => "elasticsearch.example.com"
       cluster => "elasticsearch"
     }
}

So let’s analyze these. The apache configuration now has no nesting in @fields (and there was much rejoicing), so it is considerably less cluttered. We’re writing to file here, and making the file end in ls_json (for convenience’s sake). Aside from this, there’s almost nothing different here between 1.1.x and 1.2.x configuration.

In the logstash configuration there are some big changes under the hood. Let’s look at the input first:

input {
   file {
      path => "/var/log/apache2/*.ls_json"
      tags => "apache_json"
      codec => "json"
   }
}

It’s clear we’re tailing a file here, still, so that’s the same. We’re appending the tag “apache_json” for ourselves. I opted to do this because there may be some non-json files I can’t consume this way and I want to differentiate.

The big difference here is codec. In the old example we had format => “json_event” for pre-formatted content. In Logstash 1.2.x you use a codec definition to accomplish this, but it’s not a json_event any more. The only reserved fields in logstash now are @timestamp and @version. Everything else is open.

Moving on to the filters now:

    geoip {
	add_tag => [ "GeoIP" ]
	database => "/opt/logstash/GeoLiteCity.dat"
	source => "clientip"
    }

The GeoIP filter is a wonderful addition since the early days of logstash. I won’t do more than provide a link and a basic description here. It extracts all kinds of useful data about who is visiting your web server: countries, cities, timezone, latitude and longitude, etc. Not every IP will populate every field, but we’ll get to that a bit later. Use the “source” directive to specify which field holds the IP (or host) to provide to the GeoIP filter.

    if [useragent] != "-" and [useragent] != "" {
      useragent {
        add_tag => [ "UA" ]
        source => "useragent"
      }
    }

Awesome new Logstash feature: Conditionals. Conditionals finally provide the kind of if/then/else logic that allows you to do amazing things (and probably some pretty mundane things too, ed.). Follow the link and read up on it. I’ll follow the simple flow here a bit. If the field useragent (fields are encapsulated in square braces) is not a hyphen, and is also not empty, then perform the action, which is another filter: useragent. The useragent filter breaks down a useragent string, like “Mozilla/5.0 (iPhone; CPU iPhone OS 6_1_4 like Mac OS X) AppleWebKit/536.26 (KHTML, like Gecko) Version/6.0 Mobile/10B350 Safari/8536.25” into useful fields, like device, os, major, minor, and name. If it can’t find the answer to some of these, it will populate them with “Other,” which I don’t want. So to save me some trouble, I will prevent this from happening by using the conditional. If it does succeed I will tag it with “UA” and it will parse the “useragent” field.

if [bytes] == 0 { mutate { remove => "[bytes]" } }

Another conditional here. Logstash will check to see if the bytes field is 0. If it is, it will remove the bytes field. This is more about clutter removal than anything else.

The remaining simple “remove” statement for empty GeoIP fields should be pretty simple to follow. One thing to note is that nested fields must be encapsulated as above within square braces, e.g. [geoip][postal_code], for proper parsing.

if "apache_json" in [tags] {
        if [method]    =~ "(HEAD|OPTIONS)" { mutate { remove => "method" } }
        if [useragent] == "-"              { mutate { remove => "useragent" } }
        if [referer]   == "-"              { mutate { remove => "referer" } }
    }

Here we are checking to see if the tag “apache_json” is in the array “tags” before proceeding with other conditionals. Note that the check for “method” is using a regular expression, so it uses =~ instead of ==, and is seeing if the entry is for either “HEAD” or “OPTIONS” and will remove the “method” field in either case.

If you are especially observant you may have noticed that there is no date filter in this example, though there was in the 1.1.x example linked above. The reason here is that the timestamp is already properly formatted in ISO8601 and logstash can see that and uses it automatically. This saves a few cycles and keeps the configuration file appearing clean and orderly.

output {
     elasticsearch {
       host => "elasticsearch.example.com"
       cluster => "elasticsearch"
     }

And we can’t let all of this expanded data go to waste, now can we. So we ship it out to elasticsearch where Kibana can get to it. Let’s take a quick look at what it looks like:
logstash_json_capture
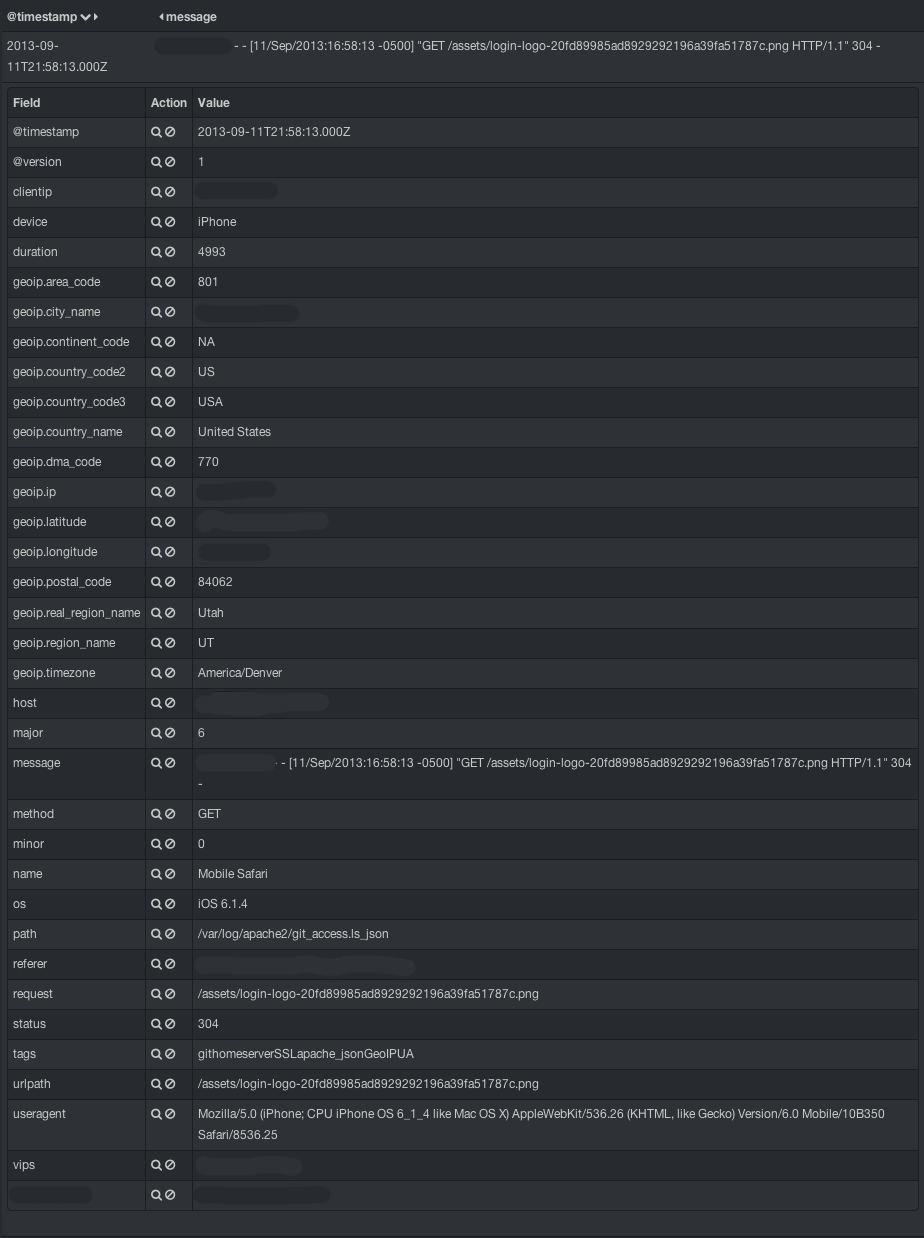
I’ve anonymized some of the data, but you can see that there are many more fields than just those few we capture from apache.

So, that’s my updated rendition of getting Apache to put JSON into logstash directly. What do you think?

I would love to hear your comments, corrections and ideas.

Using elasticsearch mappings appropriately to map as type IP, int, float, etc.

Update 2015-08-31: My most recent template/mapping can be found here.
Update 2012-11-05: My most recent template/mapping can be found here.

I am updating previous templates in blogs accordingly, just FYI.

Logstash allows you to tag certain fields as types within elasticsearch. This is useful for performing statistical analysis on numbers, such as the byte fields or the duration of a transaction in mili or microseconds. In grok, this would be as simple as adding :int, or :float to the end of an expression, e.g. %{POSINT:bytes:int}. This makes the correct mapping output when the event is sent to elasticsearch. However, since we’re trying to avoid using grok and are sending values as pre-formatted JSON, this sometimes results in values not being properly tagged.

Jordan instructed me to not encapsulate values within double-quotes if the value is a number. In doing so, the value is auto-sent as type long (for long integer). However, elasticsearch allows us to store IP addresses as type IP. This is crucial to using the range-based queries across IP blocks/subnets, e.g. clientip:[172.16.0.0 TO 172.23.255.255].

In the past, I tried putting in :ip, just like with :int or :float. I thought it was working, because I was able to do a range query. But then it became clear that it was limited to a single dotted-quad difference, such as 192.168.0.1 TO 192.168.0.255. It would not work with a larger subnet. The way to discover if this is correctly configured or not is to pull the _mapping from your index:

curl -XGET 'http://localhost:9200/logstash-2012.10.12/_mapping?pretty=true'
(truncated)
           "clientip" : {
              "type" : "string"
            },

In this case, type “string” is not desired. We want to see type: “ip”. It turns out my mapping was misconfigured. The correct way to do this is as follows (see the mappings section in particular):

curl -XPUT http://localhost:9200/_template/logstash_per_index -d '{
    "template" : "logstash*",
    "settings" : {
        "number_of_shards" : 4,
        "index.cache.field.type" : "soft",
        "index.refresh_interval" : "5s",
        "index.store.compress.stored" : true,
        "index.query.default_field" : "@message",
        "index.routing.allocation.total_shards_per_node" : 2
    },
    "mappings" : {
        "_default_" : {
           "_all" : {"enabled" : false},
           "properties" : {
              "@fields" : {
                   "type" : "object",
                   "dynamic": true,
                   "path": "full",
                   "properties" : {
                       "clientip" : { "type": "ip"}
                   }
              },
              "@message": { "type": "string", "index": "analyzed" },
              "@source": { "type": "string", "index": "not_analyzed" },
              "@source_host": { "type": "string", "index": "not_analyzed" },
              "@source_path": { "type": "string", "index": "not_analyzed" },
              "@tags": { "type": "string", "index": "not_analyzed" },
              "@timestamp": { "type": "date", "index": "not_analyzed" },
               "@type": { "type": "string", "index": "not_analyzed" }    
           }   
        }
   }
}
'

After applying this template, now I have type “ip” showing up:

curl -XGET 'http://localhost:9200/logstash-2012.10.12/_mapping?pretty=true'
(truncated)
           "clientip" : {
              "type" : "ip"
            },

The same logic is applicable to all other fields in the object @fields (logstash’s default object for everything not prepended with an @ sign). Try it out! Enjoy! Keep in mind that this will not change existing data, but will work on new indexes created after replacing your template.

Using rsyslog to send pre-formatted JSON to logstash

My last post was about sending pre-formatted JSON to logstash to avoid unnecessary grok parsing. In this post I will show how to do the same thing from rsyslog.

And again, this comes with a disclaimer. My exact model here depends on a version of logstash recent enough to have the udp input. You could do tcp here, but that’s not my example.

Prerequsites: rsyslog version 6+ (I used version 6.4.2, with more recent json patching). UPDATE: I just tested with 7.2.5 with success. The problem with earlier versions in the v7 branch were addressed in 7.2.2

bugfix: garbled message if field name was used with jsonf property option
The length for the field name was invalidly computed, resulting in either
truncated field names or including extra random data. If the random data
contained NULs, the rest of the message became unreadable.

For the record: 6.4.2 works, 6.6 does not, 7.2.5 does. These are the limits of my testing, so far.

rsyslog does what apache does (if you tell it to): escapes quotes and other characters so you can send legitimate JSON. What I did was create a template (including an @message field, to mimic what is normally logged), and then send everything to a local logstash agent over a UDP port.

## rsyslogd.conf
$ModLoad immark.so
$ModLoad imuxsock.so
$ModLoad imklog.so
$ModLoad imudp
# You only need $UDPServerRun if you want your syslog to be a centralized server.
$UDPServerRun 514
$AllowedSender UDP, 127.0.0.1, 172.19.42.0/24, [::1]/128

$template ls_json,"{%timestamp:::date-rfc3339,jsonf:@timestamp%,%source:::jsonf:@source_host%,"@source":"syslog://%fromhost-ip:::json%","@message":"%timestamp% %app-name%:%msg:::json%","@fields":{%syslogfacility-text:::jsonf:facility%,%syslogseverity-text:::jsonf:severity%,%app-name:::jsonf:program%,%procid:::jsonf:processid%}}"

*.*                                             @localhost:55514;ls_json

This sends out everything (every level/severity) to localhost:55514 (UDP) and formats with the ls_json format as defined above.

Here’s the logstash agent config, which is listening on 55514:

## logstash.conf

input {
   udp {
      port => 55514
      type => "syslog"
      buffer_size => 8192
      format => "json_event"
   }
}

I don’t need any date magic here as the @timestamp works (still don’t know why it’s flaky for apache). These events are ready for consumption, no filters necessary!

You could send the JSON out to file. This is what an example line looks like:


## JSON output

{"@source":"syslog://127.0.0.1","@type":"syslog","@tags":[],"@fields":{"facility":"cron","severity":"info","program":"","processid":"10522"},"@timestamp":"2012-09-29T17:30:00.975141-05:00","@source_host":"blackbox","@message":"Sep 29 17:30:00 : (root) CMD (/usr/libexec/atrun)"}

If you have an existing, native syslog config, you can keep it as-is, and just add the lines above to it (and re-name it to rsyslogd.conf or something). rsyslogd will continue to write out to your same files in /var/log/*whatever* and also send in json format to port 55514. Again, the idea here is minimal invasiveness: Allow the logging to continue in the way it has been, but also forward it along to a centralized server.

Getting Apache to output JSON (for logstash)

Update: This page is for the now deprecated Logstash 1.1.x and older. Look for the updated version of this here: https://untergeek.com/2013/09/11/getting-apache-to-output-json-for-logstash-1-2-x/

Last time we looked at ways to improve logstash/elasticsearch with elasticsearch templates. Today we’ll save ourselves a lot of grok parsing pain with apache’s custom log feature.

Disclaimer: This only works with versions of logstash supporting the UDP input. You can adapt this to send or log in another way, if you like, e.g. send the json to a file and have logstash tail it.

Let’s look first, then explain later. If you are using an include line in your apache config (e.g. Include conf.d/*.conf) then all you need to do is to put this in a standalone or vhost. If it’s a single-host apache, I will create logstash.conf and put this in it:

LogFormat "{ 
            "@vips":["vip.example.com","customer.example.net"], 
            "@source":"file://host.example.com//usr/local/apache2/logs/access_log", 
            "@source_host": "host.example.com", 
            "@source_path": "/usr/local/apache2/logs/access_log", 
            "@tags":["Application","Customer"], 
            "@message": "%h %l %u %t \"%r\" %>s %b", 
            "@fields": { 
                "timestamp": "%{%Y-%m-%dT%H:%M:%S%z}t", 
                "clientip": "%a", 
                "duration": %D, 
                "status": %>s, 
                "request": "%U%q", 
                "urlpath": "%U", 
                "urlquery": "%q", 
                "method": "%m", 
                "bytes": %B 
                }  
           }" ls_apache_json

CustomLog "|/usr/local/bin/udpclient.pl 127.0.0.1 57080" ls_apache_json

Some of this should look straightforward, but let me point to some pitfalls I had to dig myself out of.

  • bytes: in the @message, I use %b, but in @fields, I use %B. The reason is summed up nicely on http://httpd.apache.org/docs/2.2/mod/mod_log_config.html :

    %B Size of response in bytes, excluding HTTP headers.
    %b Size of response in bytes, excluding HTTP headers. In CLF format, i.e. a ‘-‘ rather than a 0 when no bytes are sent.

    In other words, since I’m trying to send an integer value, if I don’t choose %B, I may send a – (dash/hyphen) when there is no value to send, making the field be categorized as a string. Jordan says that sending the JSON as an integer (i.e. no quotes) should make it into ES as an integer. This may yet require a mapping/template.

  • @message: This is the apache common format. You could easily substitute in the same fields as go in the apache combined format. Or, you could leave the common format as @message and simply add the fields for user-agent and referrer if you want to collect those:
                    "referer": \"%{Referer}i\", 
                    "useragent": \"%{User-agent}i\" 
  • timestamp: Jordan has had no problems with passing @timestamp directly, but I have had nothing but problems. Perhaps I can get a solution linked here some time, but in the meanwhile, I simply spit out the timestamp here in ISO8601, and then use date and mutate in logstash.conf:
    input {
       udp {
          port => 57080
          type => "apache"
          buffer_size => 8192
          format => "json_event"
       }
    }
    
    filter {
       date {
           type => "apache"
           timestamp => "ISO8601"
       }
       mutate {
            type   => "apache"
            remove => [ "timestamp" ]
       }
    }

What comes out is ready (except for the date munging) for feeding into elasticsearch, and even has an @message field for searching. This method also makes it trivial to add extra fields (get them from http://httpd.apache.org/docs/2.2/mod/mod_log_config.html) without doing anything extra or having to re-work your patterns for grok. As I mentioned previously, I keep the common log format for @message, then add the other fields (like duration, user-agent and referer) as needed. An apachectl restart is all it takes to get the new values into elasticsearch.

And for the sake of a complete solution, the udpclient.pl script:

#!/usr/bin/perl
#udpclient.pl

use IO::Socket::INET;
my $host = $ARGV[0];
my $port = $ARGV[1];

# flush after every write
$| = 1;

my ($socket,$logdata);

#  We call IO::Socket::INET->new() to create the UDP Socket
# and bind with the PeerAddr.
$socket = new IO::Socket::INET (
   PeerAddr   => "$host:$port",
   Proto        => 'udp'
) or die "ERROR in Socket Creation : $!n";

while ($logdata = <STDIN>) {
    $socket->send($logdata);
}

$socket->close();

I also tend to think that one of the best things about this solution is that it does not interfere with your current logging solution in any degree. It simply catches more and sends it, pre-formatted, over local udp to logstash, and then to whatever output(s) you have defined.

Using templates to improve elasticsearch caching (with logstash)

This page is deprecated!

Use the default Logstash template instead.

Update 2014-05-16: Logstash now comes with a default template (which descended from these efforts): It’s available here.

Update 2012-11-05: My most recent template/mapping can be found here.

I find that logstash does a great job with the default index mapping behavior in elasticsearch if you are not sending a ton of log events.  Once that amount begins to grow, however, there is a need to manage how it is indexed.  One great way to maximize your elasticsearch performance is to use an index template.


curl -XPUT http://localhost:9200/_template/logstash_per_index -d '
{
    "template" : "logstash*",
    "settings" : {
        "number_of_shards" : 4,
        "index.cache.filter.expire" : "5m",
        "index.cache.field.expire" : "5m",
        "index.refresh_interval" : "5s",
        "index.store.compress.stored" : true,
        "index.query.default_field" : "@message",
        "index.routing.allocation.total_shards_per_node" : 2
    },
    "mappings" : {
        "_default_" : {
             "_all" : {"enabled" : false}
        }
    }
}
'

This template was awesome! I let my field cache expire after 5 minutes to prevent it from overfilling. I have compression turned on to save space. I have 4 nodes and 4 shards (plus the default of 1 replica per shard). With a fixed map of 2 total shards per node, I typically would have one primary shard and one replica per index per day. I was using @message as my default search field and dropping the _all field for space considerations. And then I learned about the soft cache type.

The field cache is awesome in elasticsearch, and you want that data to be persistent for as long as possible. It makes searches lightning fast! A 5 minute expiration time doesn’t help with that at all, and the tendency to re-cache the same data was painful. I was hoping for another solution, but could never find one. Then on the elasticsearch LinkedIn group, I found this article. http://blog.sematext.com/2012/05/17/elasticsearch-cache-usage/ After learning about this change and how it had benefited others, I had to make the change myself. Now my template looks like this:

curl -XPUT http://localhost:9200/_template/logstash_per_index -d '{
    "template" : "logstash*",
    "settings" : {
        "number_of_shards" : 4,
        "index.cache.field.type" : "soft",
        "index.refresh_interval" : "5s",
        "index.store.compress.stored" : true,
        "index.query.default_field" : "@message",
        "index.routing.allocation.total_shards_per_node" : 2
    },
    "mappings" : {
        "_default_" : {
           "_all" : {"enabled" : false},
           "properties" : {
              "@fields" : {
                   "type" : "object",
                   "dynamic": true,
                   "path": "full",
                   "properties" : {
                       "clientip" : { "type": "ip"}
                   }
              },
              "@message": { "type": "string", "index": "analyzed" },
              "@source": { "type": "string", "index": "not_analyzed" },
              "@source_host": { "type": "string", "index": "not_analyzed" },
              "@source_path": { "type": "string", "index": "not_analyzed" },
              "@tags": { "type": "string", "index": "not_analyzed" },
              "@timestamp": { "type": "date", "index": "not_analyzed" },
               "@type": { "type": "string", "index": "not_analyzed" }    
           }   
        }
   }
}
'

The change means that I don’t need cache expiry any more. The built-in GC engine will cover that for me! The downside is that it will take a full 30 days for this solution to get fully caught up as the index.cache.field.type setting can’t be applied to existing indexes.

Time to geek blog about Logstash and Zabbix again

It’s been so long since I did any kind of geek blogging I figure it’s time I lived up to my name again.

I’ve taken to running Logstash and Elasticsearch as a centralized logging engine.  I’ve been doing so for over a year now.  The cluster I created and managed for my company was indexing over 16,000 records per second during the busiest time of day.  Hopefully I’ll be able to put some useful data here for my fellow Logstash users.

I also did a lot of work with Zabbix for my company, plus consulted for another company on the side.  I’ll have to put some of those details here for anyone interested.